
5 ways fleet management software improves driver safety
Harsh-braking alerts, over-speed monitoring and driver scorecards turn raw telematics data into safer roads and lower insurance premiums.
Read moreCost Savings
From fuel savings and smarter routing to predictive maintenance and reduced idle time — the concrete ways a modern tracking platform pays for itself within months, and how leading fleets actually measure the return.
Almost every fleet that installs tracking sees a saving. Far fewer can say where it came from. That distinction matters, because the fleets that can point at the specific line items are the ones that keep the saving in year two.
Here is how the 30% figure actually decomposes, and how to measure each part rather than take it on faith.
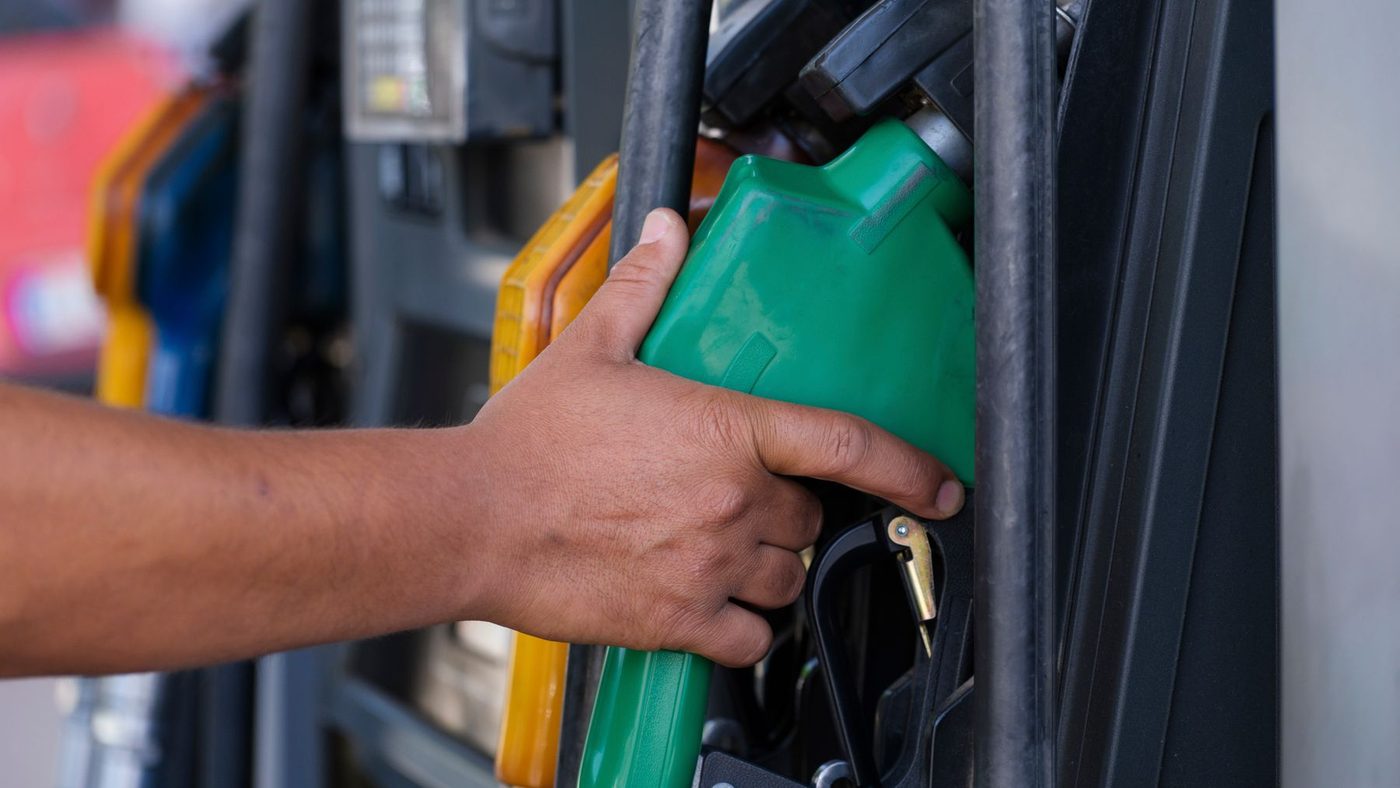
Fuel is consistently the highest share of a fleet's operating expense, which makes it both the biggest opportunity and the one most often estimated rather than measured. Three separate losses hide inside a single monthly fuel bill:
Measure this by comparing litres-per-100km per vehicle across the same route and load, not fleet-wide averages. Fleet averages hide the two or three vehicles doing most of the damage.
A serviced vehicle is cheaper than a repaired one, and a repaired one is far cheaper than a vehicle that failed mid-route with a load on board. Tracking makes servicing schedulable against real usage — distance driven for road vehicles, engine hours for plant and generators — instead of a calendar that ignores how hard the vehicle actually worked.
The measurable figure here is the ratio of planned to unplanned workshop visits. If it isn't moving, the maintenance module isn't configured properly.
Harsh braking, harsh acceleration and over-speeding cost fuel, tyres, brakes and eventually an insurance premium. On their own, individual events are noise. Attached to a named driver via a Dallas key or biometric ID and reported weekly, they change behaviour — because they stop being anonymous.
This is the saving most likely to be lost again. It depends entirely on someone reviewing the scorecard, which is why scheduled reports matter more than dashboards.
Route deviation alerts catch the problem while it is still happening rather than at month end. Find-nearest-vehicle dispatch shortens the distance to the next job. Both reduce kilometres, and kilometres are the unit almost every other cost scales with.
Rarely counted, frequently the largest single recovery. Every hour spent reconstructing where a vehicle went, whether a delivery happened, or what a driver's mileage claim should be, is an hour that scheduled reporting removes entirely.
Take a baseline before installation — fuel spend per vehicle, unplanned maintenance count, and hours spent on fleet admin. Without it you will be arguing about whether the saving is real for the next two years.
Then review at 30, 90 and 365 days. The 30-day review usually exposes theft and idling. The 90-day review shows whether driver behaviour is actually changing. The annual review is the only one that can honestly speak to maintenance, because that is the timescale servicing operates on.
The most common reason a tracking deployment stops delivering is not technical. It is that nobody logs in after month two. Any platform can show a live map; the question to ask before buying is whether the reports arrive on their own, in a format your finance team already uses, addressed to the person who can act on them.
Keep reading
Harsh-braking alerts, over-speed monitoring and driver scorecards turn raw telematics data into safer roads and lower insurance premiums.
Read more
Everything worth knowing about live positioning, update intervals and choosing the right tracker for the vehicles you actually run.
Read more
How capacitive fuel-level sensors detect siphoning and refuelling events separately, so losses get stopped before they compound.
Read moreTalk to our team about the right tracker, the right package and a live walkthrough of Pegasus — no obligation.