Live tracking
Live GPS on Google maps with stop numbers and ignition on/off messages. Replay history and trips across the year, with non-GSM and jammer areas shaded differently.
Fleet Management
Where is the vehicle? Exactly how much fuel did it burn this month? Is it running efficiently, or is it due a service it never had? Without those answers it is impossible to know which vehicles are earning and which are quietly costing you.
Benefits
Every fleet has operational problems that eat time, energy and money. These are the four areas where our customers consistently recover the most, measured over a first full year on the platform.
Idling, siphoning and route waste
More completed jobs per vehicle
Scorecards change driver behaviour
Shorter distances, fewer re-routes
Why fleets choose NaxerTech
Live GPS on Google maps with stop numbers and ignition on/off messages. Replay history and trips across the year, with non-GSM and jammer areas shaded differently.
Draw a polygon around any area — a city, a route corridor, a customer site — and be notified when a vehicle breaches it.
Track maintenance by distance driven or engine hours so every vehicle is serviced on schedule instead of after a failure.
Pegasus Atlas for Android and iOS: live tracking, replay history, notifications, POIs, reports and graphs for one vehicle or a large fleet.
Distinguish business from private use, split mileage cleanly, and book expenditure against each individual trip.
Compose the alert you need: “email me if any fleet vehicle stops more than 30 minutes at one of my distribution shops.”
Biometric readers and Dallas keys give each driver a unique ID they scan before the journey — so behaviour data attaches to a person.
Mileage-to-fuel-cost analysis, engine-on-while-standing detection and probe-level theft alerts.
Cost cutting, time saving, reduced manpower, automation and admin control — measured rather than assumed.
Fleet management benefits
Convert distance into money per vehicle, per route and per driver so the expensive parts of the operation become obvious.
Idling burns fuel and engine hours for nothing. See exactly which vehicles do it and for how long.
Speed violations cost fuel, tyres and insurance premiums. Every event is logged against the driver.
A daily snapshot of which vehicles were inside which zones, without anyone running a report.
Alerts the moment a vehicle leaves the assigned corridor, while there is still time to ask why.
Define shifts and measure what each one actually delivered against what it was supposed to.
Scheduled servicing by mileage or engine hours, with reminders before the vehicle is overdue.
Live traffic overlaid on the map so dispatchers route around congestion rather than into it.
Assign tasks against points of interest and measure dwell time at each one.
Match drivers to vehicles and shifts so every trip has an accountable name against it.
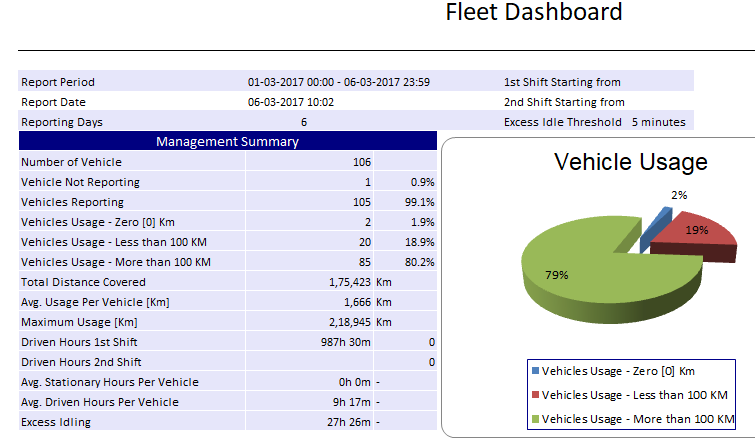
The whole operation on one screen — responding vehicles, distance covered, zero-kilometre vehicles and usage bands.
The same administrative visibility on a phone, for managers who are rarely at a desk.
Groups and sub-groups so a depot manager sees their depot and head office sees everything.
Trends over time rather than a single snapshot — the view that shows whether things are improving.
50+ report types, scheduled daily, weekly or monthly, delivered as Excel, Word or PDF by email.
Fleet dashboard
The Pegasus Fleet Dashboard summarises a chosen reporting period across the entire fleet, so the monthly management question has an answer before it is asked.
Trusted by leading fleets across Pakistan, the UK and the Gulf


















Book a demo and we'll walk your own vehicle list through the reports that matter.